Chapter 5 Digital Photogrammetric Processing
DAP is the process by which overlapping aerial images are used to derive 3-dimensional (3D) point cloud data as well as orthorectified imagery products. This is facilitated by algorithms which detect features present in multiple, overlapping images, which are in turn used to iteratively reconstruct surfaces with trigonometry. Algorithms such as Scale Invariant Feature Transform (SIFT) (Low 2004) are used to detect features of interest in images. These features are known as key points. Features which appear across multiple images, called tie points, are then used to relate each camera location in space trigonometrically. Following the identification of these features, photogrammetric software iteratively tests and validates key points to adjust estimates of camera locations. Once the locations of cameras are determined, the software uses tie point locations to build depth maps for each image. Depth maps are images where pixel values represent the distance of surfaces and objects from a view point. Depth maps are intermediary photogrammetric products which are used to create dense point clouds.
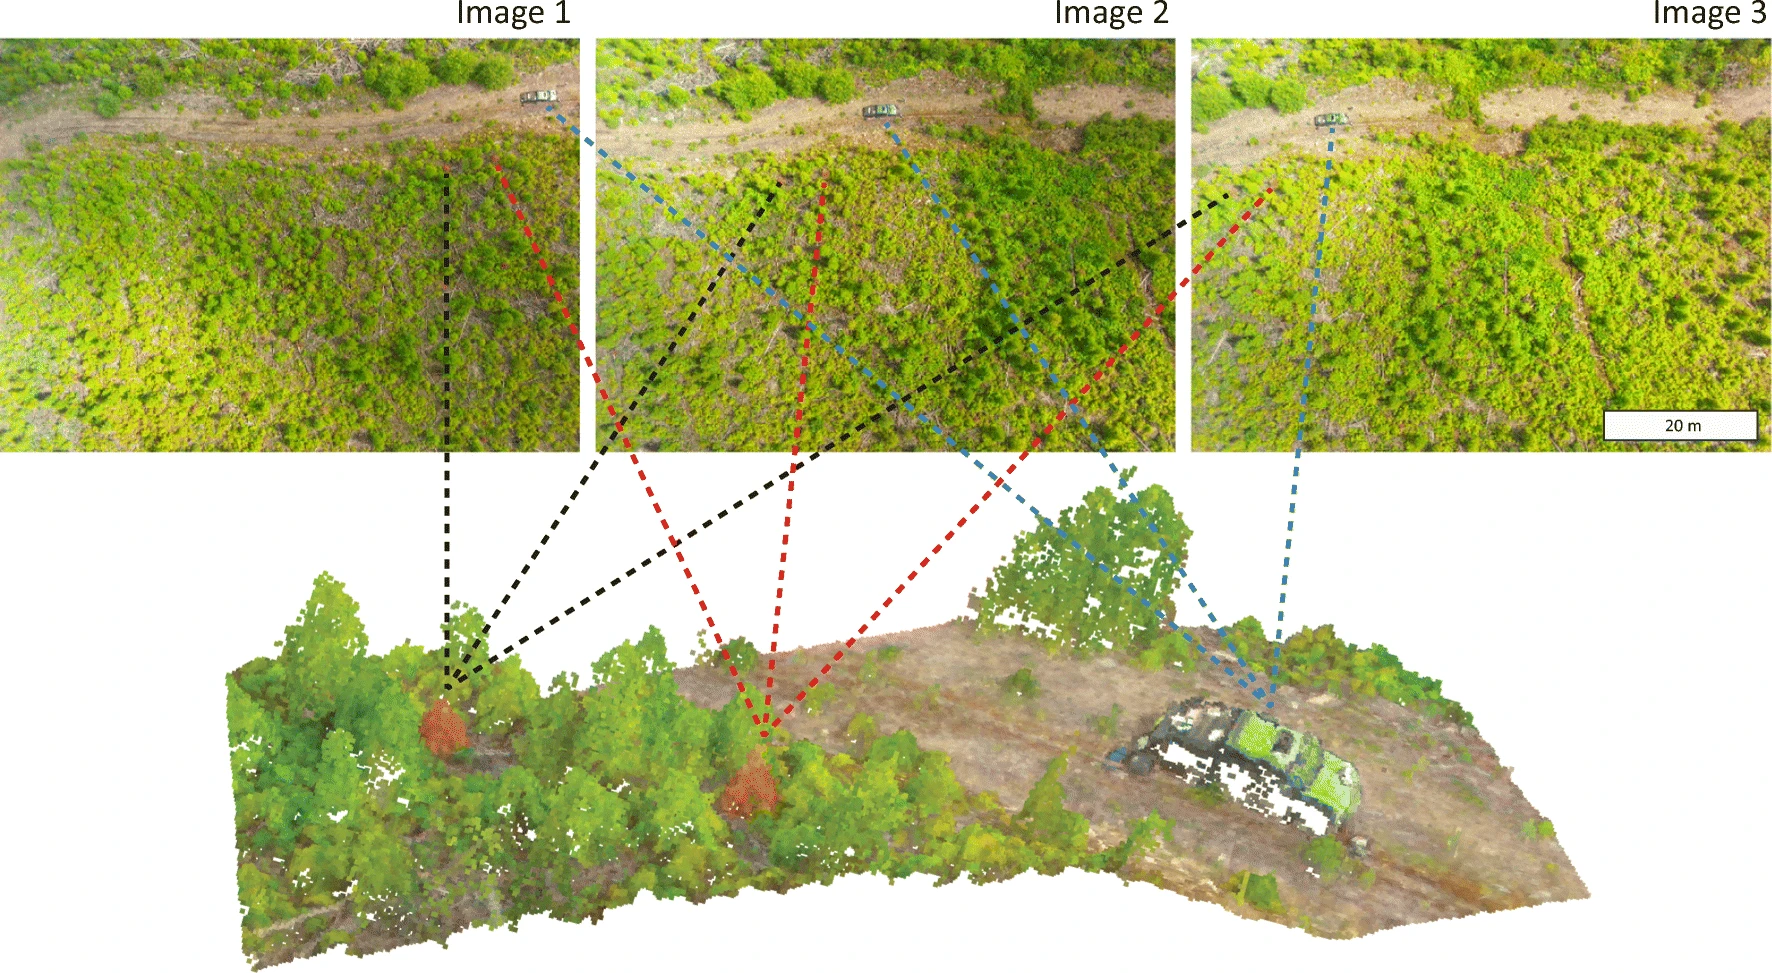
Each pixel of each image is then projected onto depth maps, which converts them into points in 3D space, which retain spectral information from the original pixel and comprise the dense point cloud. The software then stitches together the best available imagery for each point on the surfaces generated from the depth maps, creating a single image of entirely near-nadir views. This imagery can be manipulated spatially like any other georeferenced raster dataset.

5.1 Software Choices
Of the available options for photogrammetric processing software, Pix4D, and Agisoft Metashape are the most popular and best performing for processing of forested terrain. This report focuses only on Agisoft Metashape. Advantages of Agisoft Metashape include a highly modifiable API (automated programming interface), network processing, and seamless integration of MicaSense multispectral imagery among other sensors. The software is user friendly and has been used extensively in published remote sensing for forest management research (Goodbody et al. 2021), (Iqbal et al. 2018). Disadvantages include price (approximately CAD $4k - $7k per license per year, depending on how many), cryptic support and documentation, and some “black box” features which do not allow the end-user to modify or access parameters.
5.2 Agisoft Workflow Walk-Throughs
5.2.1 Imagery Organization
Depending on the sensor and volume of data collected, imagery from planned flights may be saved across multiple subfolders, and empty folders may be created. The creation of empty folders typically only occurs for multispectral sensors such as the MicaSense, which cannot be fully integrated with RPA. Regardless, it is important to inspect imagery directories to ensure that they are organized and named consistently prior to adding data to Agisoft. Some manual reorganization may be required. For multispectral acquisitions, multiple spectral bands are usually stored subfolders within the same directory and are differentiated using suffixes (e.g. _1, _2, _3, _4, _5) that correspond to each spectral band. Ensure that all RPAS imagery is backed up prior to processing in Agisoft.
5.2.2 Image filtering
Within the Agisoft MetaShape interface, it is possible to manually disable images so as to prevent them from being used in subsequent processing. Results will be improved by disabling images that are blurry or oblique, which may occur due to wind gusts or changes in flight path. It is also beneficial to eliminate images taken during takeoff and landing. Ideally, all images are taken from a near-nadir perspective and fall along a plane at a relatively constant distance from the surface of interest. For most RGB sensors, which can be fully integrated with the RPA, images will not be taken during takeoff and landing. However, blurry images may still be acquired as a result of unexpected changes in the flight path.
5.2.3 Image Alignment
Key alignment parameters determine the extent to which each image is downscaled and which image pairs will be tested for potential matches. The downscale parameter represents the length of a side of the square of pixels averaged together during downscaling. A value of 1, or High, matches images using every pixel. A value of 2, or Medium, averages 4 original pixels. A value of 0, or Highest, is used to denote an upscaling, and creates 4 pixels from each original pixel. Adjusting this parameter affects processing time and, in some cases, the number of images aligned. Images with poor overlap, minimal feature geometry, or images located along the edges of image sets will be especially affected by this parameter. A higher setting (or lower number) does not necessarily result in superior alignment.
Generic preselection and reference preselection limit the number of image pairs that the algorithm searches for. Generic preselection uses downscaled images first to determine probable pairs, while reference preselection searches for matches which are located near one another. These settings can greatly increase processing speed without sacrificing quality. Key point and tie point limits set caps on the number of points which can be generated and matched, respectively. Increasing these values or setting them to 0 (unlimited) can increase processing time but can improve results in some cases.
5.2.4 Sparse Cloud Filtering
Clusters of tie points are used to construct the depth maps. Therefore, the points included in the sparse cloud ultimately determine the quality of the depth maps, dense cloud, and elevation products. By eliminating erroneously matched points from the sparse cloud based on quality criteria and then resetting camera alignment, the quality of depth maps can be improved. The “gradual selection” tool in MetaShape offers several quality criteria to choose from; the “reconstruction uncertainty” option seems to be especially useful for forested scenes. A threshold between 15 and 50 seems to be effective in eliminating problematic points without losing useful data.
5.2.5 Depth Map Generation
Like image matching, the generation of depth maps is also pixel-based and can be downscaled. The degree of downscaling directly affects the detail of the dense point cloud. Downscaling the depth maps will dramatically increase processing time but will result in smoothed surfaces and compromise canopy structural metrics.
5.2.6 Depth Map Filtering
Filtering of depth maps balances data loss with noise generation at the dense cloud level. Isolated noise points occurring beneath the ground surface are not detrimental to data quality, because they are typically eliminated after a ground model is created and the point cloud is normalized. Noise points and artifacts occurring at the tops of tree crowns are much more of a concern. The “mild” option for depth map filtering is the recommended setting, achieving a balance between elimination of erroneous outliers and flattening of canopy structure. This setting has been shown to perform well for tree detection and height estimates in open-canopy conifer forests (Swayze et al. 2021).
5.2.7 Multispectral (MicaSense)
Multispectral and RGB imagery can be processed using similar workflows. It is often desirable to extract structural canopy information from high-resolution aerial RGB photography and calibrated spectral data from multispectral imagery acquired for the same site at the same time.
When dealing with multispectral imagery, MetaShape groups corresponding images as multi-camera systems. Most of the processing is similar, however, the “Calibrate Reflectance” step is a key difference. This step can be performed before photo matching. Reflectance panel images can be located automatically, and will automatically be disabled for subsequent steps. If a downwelling light sensor (DLS) was used during flight, the use_sun_sensor tag should be set to true.
The algorithms used in image matching are capable of operating between different image types, meaning that key points can be detected in single-band multispectral images and RGB photographs. The two datasets can be processed in separate chunks and aligned using “Align Chunks”; a low or medium accuracy is usually sufficient for this type of alignment. It is also possible to align RGB and MS imagery in a single chunk before exporting the aligned images to a new chunk and proceeding. This method can sometimes allow alignment of problematic image sets with poor geometry or insufficient overlap.